Week Starting 6/24/19 (Week 4)
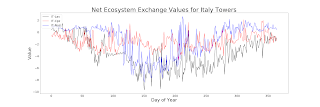
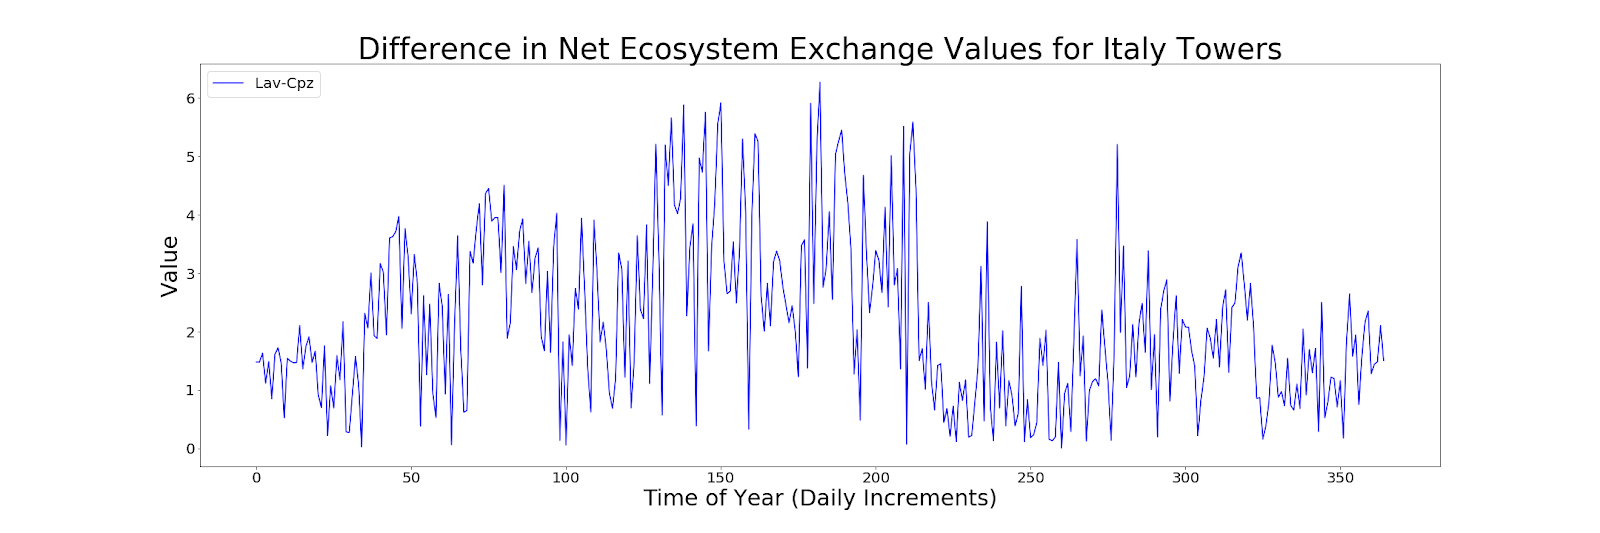
This week we started working with multiple different methods for determine similarities in the FLUXNET dataset. So far I have created graphs that compare several variables such as Net Ecosystem Exchange, Heat flux, and more for both hourly and daily values. I also worked on a presentation of my progress. Below are the graphs hourly and daily Net Ecosystem Exchange of three Italian towers in 2002. I also created graphs for the absolute value of each difference. Below are the differences between the towers with respect to the Net Ecosystem Exchange.


Comments
Post a Comment