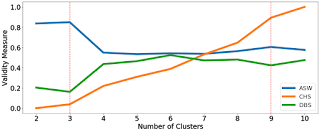
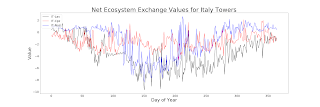
This week I started clustering the data after using multiple distance algorithms on the v, specifically Dynamic Time Warping (DTW), Fourier Coefficients, Autocorrelation, and the Euclidean Distance. After the clusters have been calculated, a cluster validity algorithm have to be run in order to determine the optimal number of clusters. The cluster validity algorithm included the Average Silhouette Width (ASW), the Calinski Harabasz Score (CHS), and the Davies-Bouldin Score (DBS). These metrics are set up in such a way that we want to obtain the highest Average Silhouette Width (ASW) and Calinski Harabasz Score (CHS) and the lowest Davies-Bouldin Score (DBS). For the variable air temperature, the best results so far have come from running DTW and running that through a dimensionality reduction algorithm called Uniform Manifold Approximation and Projection (UMAP). Result of the silhouette width where the red line is the average (Left) and visual representation of data with t...


Comments
Post a Comment